By T Randall and R Koech.
First published in Water e-Journal Vol 4 No 1 2019.
Abstract
Water meters are used for urban water management, especially for billing purposes. The relatively recent Smart Water Metering (SWM) technology provides high resolution and frequent water consumption data which can be used to improve feedback to consumers and thus enhance water conservation and management. This study reviewed the SWM technology and used a smart water metering pilot project to analyse the water consumption trends, and demonstrate the potential water conservation benefits of the technology. Out of a total of 158 water meters used in the study, 21 were found to have elevated baseline flows most likely caused by water losses from internal pipework leaks and leaking taps or appliances. The proportion of potential water loss to the total water usage ranged from 1.56 to 46.73%. Further research required in order to optimise the benefits of the technology is highlighted.
Introduction
In the recent past, the demand for freshwater worldwide has increased largely due to the world’s growing population, as well as changing lifestyles and eating habits that have been associated with higher water consumption. The increase is more pronounced in urban settings which normally have higher population densities in addition to production industries that typically consume large amounts of water. In Australia, nearly 90% of the population live in urban areas (ABS 2013).
The supply of water to urban areas in Australia is mainly the responsibility of state government-owned water utility companies and local councils. These agencies own and maintain water supply infrastructure including water meters, and their business model is in many aspects a monopoly since there are no competitors in the market.
In general, the supply of freshwater to urban areas for domestic and industrial use has become more challenging, and this has been exacerbated by the adverse effects of climate change. The typical response to the problem of scarcity of freshwater resources is to use a variety of methods to conserve water, which practically means using less water while avoiding or minimising wastage. Water conservation in urban areas has increasingly taken an integrated management approach, and has gone beyond the use of measures such as flow-restricting taps and showers, optimisation of toilet and urinal flushing, and now commonly includes the use of water-efficient appliances and technologies like waterless urinals, electronic taps, automatic leak detection, rainwater harvesting and effluent water reuse (Hauber-Davidson 2006).
Perhaps the most effective strategy that is widely used for effective urban water management is water metering. The purpose of a water meter is to measure the amount of water (usually on a volumetric basis such as litres or mega litres) supplied to a consumer over a specified period, traditionally for billing purposes (Irons et al. 2015). In Australia, the water reforms that were initiated following the Council of Australian Governments (COAG) agreement in 1994 introduced universal metering of water in urban areas to, among other things, ensure equity in water usage charges and better demand management (Neal 1994).
Conventionally, water meters have to be physically read at a set time interval, a process that can be both labour and time-intensive. For most domestic residences in Australia, meter reading is undertaken on a quarterly basis. While this may be adequate for billing purposes, it provides limited information on actual water use behaviour, leakage and seasonal variation (Aravinthan et al. 2012). Effective management of water resources requires accurate, timely and reliable measurement and monitoring of water consumption practices (Willis et al. 2010).
Hence, in more recent times, a developing technology known as Smart Water Metering (SWM) is now being used in many countries including in Australia (Drubin, 2016). SWM technology allows water authorities to gain water meter readings remotely and at a higher frequency, and in a format that can be utilised for various purposes including demand and consumption management, leakage detection and water conservation (Drubin 2016; Oren and Stroh 2013). In particular, the ability to collect, analyse and relay water use data to the water user almost in real-time has the potential to cause significant changes in water use behaviour patterns (Aravinthan et. al. 2012). Smart water meters are thus seen as a means of improving feedback to water users (Darby 2010). A survey of the water utilities in Australia and New Zealand found that the main benefits of the SWM technology include: water savings, cost savings, increased revenue, customer satisfaction and enhanced community engagement (Beal and Flynn 2014).
The emerging SWM technology therefore presents many opportunities to water authorities; however, the infancy of this technology also creates various challenges. Water authorities need to be able to justify the commitment for the capital expenditure required by having a clear understanding of their potential benefits (in terms of water conservation and management) as compared with conventional water meters. Limited research has been undertaken to quantify the potential water management and conservation benefits of this new technology.
The specific objectives of this study were to:
- Review the use of SWM technology for water management and conservation;
- Use a case study of Port Macquarie-Hastings Council (PMHC) to analyse the water consumption patterns of different types of consumers and identify potential water losses and opportunities for water conservation; and
- Identify issues that require further research.
Unlike the majority of previous smart water meter research which focussed on domestic water consumers in or around metropolitan cities, this study includes other categories of consumers such as commercial buildings and units, and council and community-owned buildings. It is anticipated that the findings from this work would contribute to the limited body of knowledge on smart water metering in Australia and overseas.
Review of smart water meters
A smart water meter is a standard or conventional water meter, and fundamentally performs the same function. However, to make it ‘smart’, the meter is attached to a device that allows continuous electronic reading, storage, display and transfer of water consumption data (Figure 1). In this paper, the combination of the standard water meter and the ‘smart’ is referred to as ‘smart water metering (SWM) technology’. The amount or variety, and frequency of logging and transfer of data obtained depends on how the water meter has been configured (Cole and Stewart 2013). The typical time interval of data capture and storage for residential smart water meters is hourly.
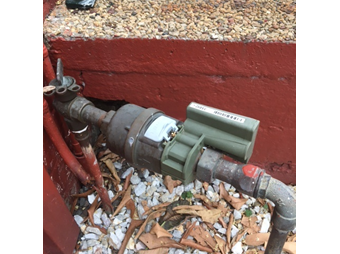
The water meter shown in Figure 1 is a mechanical meter which is commonly used for residential water metering in Australia. In the very recent past, fully integrated ultrasonic (electronic) smart water meters have become available in Australia. These meters have inbuilt communication systems such as the NB-IoT (Narrowband Internet of Things), and are seen as the next generation of smart water meters.
Smart water meters are basically tools used to measure water use, and thus on their own cannot influence water consumption patterns. Rather, it is the high frequency (and resolution) information from them that is used to make the appropriate decisions on consumption. A number of studies that have been undertaken (e.g. Doolan 2011) have demonstrated that information provided by smart water meters can bring about behavioural change in customers which may lead to reductions in water consumption. Some studies have attempted to quantify these benefits, and showed that reduction in consumption is attainable (Table 1). Table 1 also shows the specific strategies employed in these studies to conserve water, which mainly involve better engagement with consumers including timely, and in some cases real-time provision of consumption data, and rapid leak detection.
|
Study description |
Strategy |
Water conservation benefit |
Reference |
|
A smart water meter study in two suburbs located in mid-coast of New South Wales. |
Provision of detailed and customised water-use information to household, made possible by use of SWM technology. |
Changed consumer behaviours (e.g. shorter showers) leading to water savings of approximately 8%. |
Liu et al. (2016) |
|
Smart water meter studies undertaken in different locations by different researchers. |
Providing consumption feedback to customers. |
Reduction of water consumption between 3 and 53.4%, with an average of 19.6%. |
Sonderlund et al. (2014) |
|
Sydney Water’s smart metering residential project. |
Use of digital in- home display to provide customers with near real-time water consumption data. |
Reduction in water consumption in households of between 7% and 10%. |
Doolan (2011) |
|
Smart water meter study in Hervey Bay, Queensland, to identify households with post-meter leakage. |
Communications with the households, including fact sheets and details of potential losses. |
Reduction in baseline flows of 89% . |
Britton et al. (2013) |
|
Mackay Regional Council and TasWater, Australia. |
Rapid leak detection and better customer engagement. |
More than 10% reduction in residential water demand. |
Beal & Flynn (2014) |
Currently in Australia, water utilities have mainly implemented smart water metering projects on a pilot basis. The Wide Bay Water Corporation (WBWC) smart metering project, which started about a decade ago, is the first large-scale implementation of SWM technology (Turner et al. 2010).
In a recent study, Beal and Flynn (2014) found that in Australia and New Zealand, overall, the adoption of smart water meters is on the increase. The study also found that the key drivers of smart water meters include: better engagement with water consumers; improvement in water infrastructure planning, and potentially deferring or augmenting some investments; better peak demand forecasting and management; reduction in manual meter reading; and reduced operating costs. These findings were largely corroborated by a study by Smit et al. (2015) that was undertaken in a number of European Union (EU) countries. The additional drivers cited by the EU study include the motivation by water utilities to adopt measures that are generally viewed as being sustainable, and thus enhance their reputation amongst their clients.
Apart from the driving factors noted above, there are other forces that could contribute to the expansion of smart water use in the future. Boyle et al. (2013) raised the possibility that some technology vendors (e.g. communication and data handling companies) see the potential of gaining customer profiles, which are important for market information, as an incentive for driving the use of smart water metering. Increased market competition among vendors might also make the prices of smart water meter gadgets decrease, further increasing the adoption of the technology. Another factor is the rising energy costs, and the concern that this might increase the cost of water, thus influencing the use of smart water meters in order to reduce demand and deliver savings. A study by Binks et al. (2016) showed that water-related energy use (for delivery and use at homes) in Melbourne and Brisbane respectively, ranged from 13-24% and 76-79% of total household energy use.
A number of challenges associated with the use of smart water meters have been identified in previous research, and include data management, interpretation and analysis in addition to privacy (Boyle et al. 2013). A survey of water utilities in Australia and New Zealand (Beal and Flynn 2014) found that there is a general need to share more water use information with customers by using two-way communication technologies in smart water meters.
Smart water meter case study: Port Macquarie-Hastings Council (PMHC) Pilot Project
Project and data description
The case study utilised a smart water metering trial project installed in the town of Port Macquarie within the Port Macquarie-Hastings Council (PMHC), which is located in the mid-north coast of regional New South Wales, Australia. The study utilised smart water meter data collected over a period of six months (from 1st August, 2015 to 31st January, 2016). The specific case study area is within Port Macquarie’s city central business district (CBD), and had a total of 158 water meters installed in different premises. The installation was a radio frequency-type system that captured hourly meter reads for all the 158 meters. A calibrated pulse output from each meter was transmitted via low energy radio network to a single radio receiver device, which in turn forwarded all water meter reading information to a cloud-based database using a mobile network.
The 158 water meters used for this study fell under five categories of consumers (Table 2):
- PMHC buildings – facilities owned by PMHC such as bus terminal, pump stations and toilet blocks.
- Residential – residential houses and units within the study area.
- Commercial buildings – commercial business properties (e.g. shopping malls).
- Commercial units – unit complexes for commercial office spaces.
- Non rateable – community-owned buildings (e.g. churches) exempt from paying water rates.
The water meter sizes ranged from 20 mm diameter (DN20) to 100 mm diameter (DN100). Nearly half of the meters were size DN20, while four out of the five DN100 meters were used in commercial buildings. Since this study was undertaken within the CBD, more than 75% of the meters were installed in commercial buildings and units (Table 2).
|
Consumer type |
Meter size (mm/DN) |
Total |
||||||
|
20 |
25 |
32 |
40 |
50 |
80 |
100 |
|
|
|
PMHC buildings |
3 |
2 |
3 |
1 |
3 |
0 |
0 |
12 |
|
Residential |
6 |
0 |
1 |
5 |
2 |
0 |
0 |
14 |
|
Commercial buildings |
36 |
22 |
12 |
9 |
6 |
3 |
4 |
92 |
|
Commercial units |
21 |
3 |
0 |
1 |
1 |
2 |
1 |
29 |
|
Non rateable |
4 |
3 |
2 |
1 |
0 |
1 |
0 |
11 |
|
Total |
70 |
30 |
18 |
17 |
12 |
6 |
5 |
158 |
There were four parameters captured and sent during the data collection process by each smart water meter: meter unique identification number, date, time and meter reading value in litres. The system also sent information packages for the previous three meter reads, a strategy that is normally used to allow the back-filling of data should there be any communication issues. The cloud-based data storage could be accessed via an internet portal. Six-month data (from 1st August, 2015 to 31st January, 2016; 24 meter reads per day for each meter) for the 158 meters were downloaded as a CSV file download.
As indicated earlier, meter readings from conventional water meters are normally collected quarterly. In this study, these data were extracted from the six-month data collected using the SWM technology. The data contained the record of water consumption as at 31st October 2015 and 31st January 2016, which represented consumption in litres in the preceding three months.
Data analysis
The CSV file was converted into Microsoft Excel® in order to undertake data analysis. Macros were created in Microsoft Excel to complete the initial statistical analysis of the data (average consumption per day per water user and minimum average flow rate).
A range of further statistical analyses were undertaken on the data using Microsoft Excel and the software IBM SPSS® Statistics (Version 24). To determine the water consumption trends over the study period, monthly consumption data of the five consumer types were plotted in graphs. Box plots were plotted using SPSS to assess the variability of water consumption with the five consumer groups.
Two strategies were used to assess and quantify the opportunities for water conservation: the ±50% deviation and the non-zero baseline (minimum) flow rate rules. The existing billing rule at PMHC (which was based on the conventional meter data) was to automatically isolate water meters that had recorded deviations or change in consumption of ±50% over two consecutive billing periods, and recommend further investigations on the water consumption patterns of the properties concerned. The rationale behind this rule was that any significant (±50%) variation in consumption was likely to indicate incidences of water losses, for instance through leakage.
This research also leveraged on the capability of the SWM technology to determine the baseline flow rate for each meter. For a typical water consumer, it is generally expected that at some point within a 24-hour period, the minimum flow rate would be zero, meaning no water flow through the meter (zero consumption). The records of the properties that returned non-zero average minimum flow rates were scrutinised to determine the potential causes of elevated baseline flow rates other than leaks.
The calculation of the potential water saving was based on the properties exhibiting elevated (non-zero) baseline water meter readings without rational reasons (this was assumed to be caused by factors such as leaks). Microsoft Excel and the SPSS software were used in the analysis of potential water saving using the SWM technology.
Results and discussion
Water consumption trends
The trend of the average water consumption in the study area over the six-month study period is shown in Figure 2. The study spanned one month in winter (August), the entire spring (September to November) and two summer months (December 2015 and January 2016). The average total water consumption for the 158 meters was determined to be 533 000 litres per day (L/d). On average, the commercial buildings and the residential consumers had the highest and lowest average daily consumption, respectively.
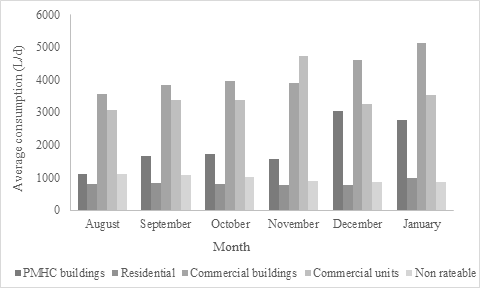
Figure 2 shows that the average water consumption generally increased from winter to spring and was highest during summer. This finding is consistent with research undertaken in other Australian cities, for instance Melbourne (Rathnayaka et al. 2015) and Adelaide (Arbon et al. 2014), which found that domestic water use for showering, irrigation, swimming pools and evaporative cooling are significantly higher in summer than in winter.
The level of detail, frequency and format of data generated from the SWM technology enables straightforward analysis, including the determination of the temporal and spatial water consumption patterns. If water consumption analysis is undertaken on a larger scale (say a suburb or town) using averages of all meters sampled, it is possible to determine the peak hour, day and month demand which is useful for water management purposes (Cole and Stewart 2013). Understanding water consumption patterns is vital for integrated water management, and plays a big role in demand forecasting and other types of water modelling. This information may also enable both water utilities and customers to identify potential water losses and formulate appropriate water conservation strategies.
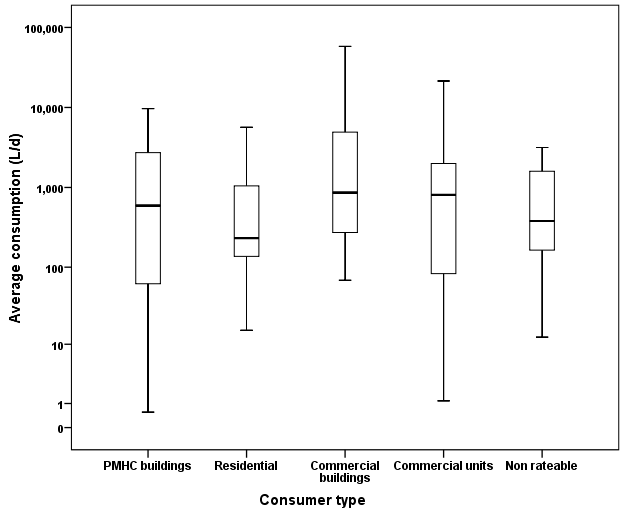
The variability of average daily water consumption (averaged over the six month study period) for each of the five consumer groups is shown in Figure 3. The 158 water meters were spread out in the study area (Port Macquarie’s CBD) and hence the data also represented the spatial variability of water consumption. Consistent with the monthly average water consumption shown in Figure 2, the commercial buildings and the residential customers had the highest (865/4166 L/d) and the lowest (247/832 L/d) median/mean water consumption, respectively. The commercial buildings had the highest range, with a minimum and maximum of 0.04 and 58083 L/d, respectively. The residential average water consumption of 832 L/d compares closely with the household daily consumption of 900 L in Riverina County Council, which is also a regional council in NSW (Riverina Water County Council 2017).
Identifying potential water loss using SWM technology
In Table 3, it is shown that in 36 out of 158 (or 22.8%) water meters, the average consumption recorded by the end of January 2016 (consumption period: November 2015 – January 2016) had deviated from the consumption recorded by the end of October (consumption period: August - October 2015) by more than ±50%. This amount of deviation was considered by the PMHC as excessive and would normally trigger further investigations, including contacting the customer.
|
Consumer type |
Meter size (mm) |
Total |
||||||
|
20 |
25 |
32 |
40 |
50 |
80 |
100 |
|
|
|
PMHC buildings |
1 |
1 |
3 |
0 |
2 |
0 |
0 |
7 |
|
Residential |
3 |
0 |
0 |
1 |
1 |
0 |
0 |
5 |
|
Commercial buildings |
10 |
3 |
1 |
2 |
0 |
0 |
0 |
16 |
|
Commercial units |
3 |
1 |
0 |
0 |
0 |
1 |
1 |
6 |
|
Non rateable |
1 |
0 |
1 |
0 |
0 |
0 |
0 |
2 |
|
Total |
18 |
5 |
5 |
3 |
3 |
1 |
1 |
36 |
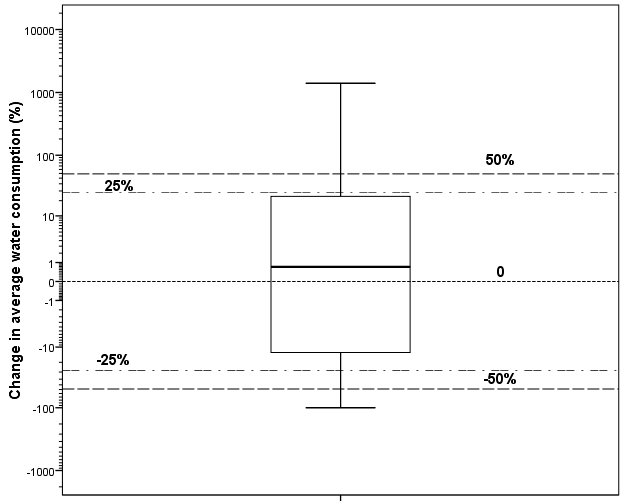
However, it is shown in Figure 4 that approximately 75% of the meters recorded deviations of between -25% and 25% (as shown by the interquartile range), and the median was very close to zero (0.71%). It was also noted that water meters that had recorded very low consumption in one billing period (considered as outliers in Figure 3), were more likely to have deviations of ± 50% overall if there was a change in the next billing period.
As noted earlier, the hourly data from the SWM technology make it possible to determine the minimum average flow rate per day, and to identify the meters with non-zero baseline flow. For a residential consumer, a zero-flow situation would be expected to occur when there is no person at home, people are asleep or when people/appliances are not using water. On the other hand, there are businesses which close at certain times and hence consumption would normally be expected to be zero. Exemptions where water consumption would not return to zero include commercial businesses that operate continuously (do not close), cooling towers for large air conditioning systems and a range of fixed flow appliances.
The analysis showed that in 35 out of the 158 water meters, the minimum flows did not reach a zero value. Seven of these meters had recorded deviations of ±50% (Table 3). These individual properties were scrutinised to determine potential consumption sources, other than leaks. This was achieved by looking at individual property addresses, analysing the property water use, customer type and any possible explanation for the elevated water use such as commercial swimming pool, air conditioning cooling towers or business use. This analysis found that 14 out of the 35 meters had rational reasons (e.g. swimming pools and air conditioning systems) for excessive baseline water consumption.
The elevated baseline readings of these 21 water meters were most probably caused by internal water losses from internal pipework leaks, leaking taps or appliances. The average hourly minimum flow rate (over the six month period) of each meter was used to determine the potential daily water loss. In effect, this minimum flow rate was assumed to have occurred throughout the study period. Table 4 shows that the proportion of potential water loss to the total water usage ranged from 1.56 to 46.73% for the meters affected. The table also shows that the potential water loss per day was 8312.92 litres. A study undertaken in a Sydney suburb and reported earlier in this paper (Doolan 2011) found that on average total water loss due to leakage was about 3% per customer.
|
Meter No. |
Average consumption (L/d) |
Average minimum flow (L/hr) |
Potential water loss (L/d) |
Proportion of potential water loss to total usage (%) |
|
112 |
8384.36 |
100.09 |
2402.04 |
28.65 |
|
74 |
6620.56 |
47.96 |
1151.08 |
17.39 |
|
62 |
2656.88 |
41.05 |
985.24 |
37.08 |
|
55 |
5133.16 |
29.17 |
700 |
13.64 |
|
129 |
3766.36 |
18.40 |
441.68 |
11.73 |
|
50 |
1316.92 |
14.84 |
356.12 |
27.04 |
|
67 |
817.08 |
14.60 |
350.44 |
42.89 |
|
69 |
2720.76 |
13.33 |
320 |
11.76 |
|
14 |
448.56 |
7.86 |
188.72 |
42.07 |
|
26 |
6308.52 |
7.50 |
180 |
2.85 |
|
93 |
3221.40 |
7.03 |
168.72 |
5.24 |
|
72 |
320.96 |
6.25 |
150 |
46.73 |
|
131 |
3594.52 |
5.85 |
140.32 |
3.90 |
|
44 |
573.28 |
5.42 |
130.08 |
22.69 |
|
46 |
317.44 |
5.01 |
120.32 |
37.90 |
|
80 |
1993.64 |
5.00 |
120 |
6.02 |
|
68 |
6427.28 |
4.17 |
100 |
1.56 |
|
73 |
568.72 |
4.17 |
100 |
17.58 |
|
79 |
1004.64 |
4.10 |
98.4 |
9.79 |
|
63 |
1993.92 |
2.93 |
70.4 |
3.53 |
|
82 |
772.04 |
1.64 |
39.36 |
5.10 |
|
Total |
|
|
8312.92 |
|
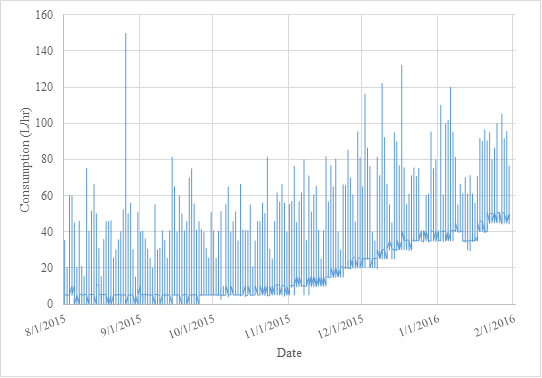
As an example of a suspected case of water loss through leakage, the water consumption pattern of one of the meters in Table 4 is shown in Figure 5. The figure shows that the baseline reading was zero up to the last week of September 2015 when leak(s) developed. The leakage progressively worsened during the case study period. The leakage was confirmed by contacting the customer and subsequently inspecting the premises.
It can be seen from the above analyses that the billing rule which was being used based on further investigations of consumptions that deviated by more than ± 50% in two consecutive billing periods is useful in identifying incidences of water losses. However, using this procedure, it is impossible to quantify potential water losses, and hence potential savings. On the other hand, this magnitude of deviation in consumption does not necessarily imply water losses. For instance, in the case of residential consumers, if the property has no resident for an extended period of time (e.g. away on holidays), there is likely to be very low or no water use at all. When this is compared to periods when there is a resident within the property consuming water, there is likely to be significant differences. In contrast, an elevated baseline without any justification almost always indicates that water is being lost.
This case study has demonstrated the opportunities for water conservation using the SWM technology. With the use of conventional water meters, issues such as leaks that can alter consumption can go on unnoticed. While customers are responsible for paying for the metered consumption (including losses that occur after the meter), water authorities are required to supply an elevated amount of water to meet the demand. The elevated water demand becomes the ‘normal’ for future consumption calculations. This has cost implications on the operation of the water supply infrastructure, for instance in terms of maintenance and monitoring.
It is acknowledged that there may be other explanations for the elevated baseline readings, for example water meter inaccuracies, data transmission or processing issues. However, in this study, there was very little likelihood that these factors affected the baseline flows. The water meters used were in calibration and had passed the regular monitoring performance evaluation. The possibility of data transmission and processing errors were also ruled out because manual records were available for comparison purposes.
Whilst the identification of issues potentially leading to water loss is perhaps the critical first step, appropriate measures must be undertaken in order to achieve the full potential of the water conservation through the SWM technology. Intervention could be in the form of customer notifications, leak repairs, network and pressure management.
Further research
Based on the case study undertaken for this study as well as the literature reviewed, a number of issues that are either undergoing or require further research in order to optimise the benefits from smart water meters are summarised below. These might also provide an indication of the direction smart water meters might take in the future.
- Form, type and quantity of feedback data to consumers. As smart water technology continues to evolve, the urban water industry is researching the form, quality and quantity of feedback that should be provided to their clients. The high resolution data potentially available from smart water meters can be analysed and manipulated in essentially unlimited ways, including consumption patterns. It is also possible to disaggregate the total household water consumption into the different usage components, for instance shower and washing machine (Cole and Stewart 2013). This will help water users to identify appliances and practices that are water-efficient. Research in this space might also identify further opportunities for water conservation.
- User interface and intelligent water networks. The prospect of water consumers having the ability to view their real time water consumption on a screen is not far-fetched, especially because internet (WiFi) is available in most homes in Australian urban areas. This will give consumers the ability to identify and rectify issues (such as leaks) quickly, and thus save water. These interfaces can also be developed into mobiles apps.
- Network flow and pressure monitoring. Monitoring the flow of water in supply network using a variety of sensors to measure characteristics such as flow rate and pressure has the ability to enable water utilities to undertake real time water balance calculations, and matching bulk flow with consumption data from smart water meters. This way, water losses (for example from leaks) will be quickly identified.
- Prompt investigation and resolution of suspected incidences of water losses. Water conservation in urban areas can only be actualised if investigations of suspected water losses are expedited and quickly resolved. These investigations may be time and labour-intensive. This is an area that is expected to evolve in the future.
Conclusion
The review of literature undertaken for this study found that the adoption and use of smart water meters is on the increase in Australia and New Zealand. The SWM technology is constantly evolving, with fully integrated ultrasonic smart water meters having inbuilt communication systems now available in Australia.
In agreement with previous research in other Australian cities, the water consumption patterns at PMHC were found to vary both spatially and temporally. Generally, water consumption in most properties was highest and lowest in summer and winter, respectively. Out of a total of 158 water meters used in the study, 21 were found to have elevated baseline flows most likely caused by water losses from internal pipework leaks and leaking taps or appliances. The proportion of potential water loss to the total water usage ranged from 1.56 to 46.73%. The case study demonstrated opportunities for water saving, which include providing consumption feedback to the consumers and taking the necessary interventions (e.g. leakage repair).
Aspects of smart water meters that are either under research or need further research include: feedback data to consumers; user interface and intelligent water networks; flow and pressure monitoring; and investigations and resolution of issues.
About the authors
Terry Randall
Terry Randall is currently in the role of Group Manager Water and Sewer at Port Macquarie-Hastings Council and has 21 years’ experience in the water industry. Terry has built his career from humble beginnings as a mechanical fitter, and later gaining qualifications in mechanical and civil engineering.
Dr Richard Koech
Dr Richard Koech is currently a Lecturer and Head of Course (Agriculture) at Central Queensland University, Bundaberg Campus. He has both undergraduate and postgraduate qualifications in agricultural engineering. He has over 20 years’ experience in higher education and industry.
References
ABS (2013). Australian Social Trends. Australian Bureau of Statistics, cat. no. 102.0, Canberra. Available from: http://www.abs.gov.au/AUSSTATS/abs@.nsf/Lookup/4102.0Main+Features30April+2013#back7 (Accessed 22 October 2017).
Aravinthan, V., Ho, G., Gray, J., Butler, R., and Connell, D. (2012). What are smart meters? [Fact sheet]. Available from: https://eprints.usq.edu.au/21068/1/Aravinthan_Ho_Gray_Butler_Connell_FactSheet_PV.pdf (Accessed 16 February 2017).
Arbon, N., Thyer, M., MacDonald, D.H., Beverly, K., and Lambert, M. (2014). Understanding and predicting household water use for Adelaide. Goyder Institute for Water Research Technical Report Series No. 14/15, Adelaide, South Australia.
Beal, C.D, and Flynn, J. (2014). Toward the digital water age: Survey and case studies of Australian water utility smart-metering programs. Utilities Policy, 32, 29-37.
Binks, A. N., Kenway, S. J., Lant, P. A. and Head, B. W. (2016). Understanding Australian household water-related energy use and identifying physical and human characteristics of major end uses. Journal of Cleaner Production, 135, 892-906.
Boyle, T., Giurco, D., Mukheibir, P., Liu, A., Moy, C., White, S., and Stewart, R. (2013). Intelligent Metering for Urban Water: A Review. Water, 5 (3), 1052-1081.
Britton, T. C., Stewart, R. A., and O’Halloran, K. R. (2013). Smart metering: enabler for rapid and effective post meter leakage identification and water loss management. Journal of Cleaner Production, 54, 166-176.
Cole, G. and Stewart, R. A. (2013). Smart meter enabled disaggregation of urban peak water demand: precursor to effective urban water planning. Urban Water Journal, 10(3), 174-194.
Doolan, C. (2011). Sydney Water’s Smart Metering Residential Project: An insight into the benefits, costs and challenges of smart metering. Water, 38, 77–80.
Drubin, C. (2016). Smart Meter Rollouts from Water Utilities Gain Momentum. Microwave Journal, 59
Hauber-Davidson, G., and Idris, E. (2006). Smart water metering. Water, 38-41.
Irons, M.L., Boxall, J., Speight, V., Holden, B., and Tam, B. (2015). Data driven analysis of customer flow meter data. Procedia Engineering, 119, 834-843.
Koech, R. Gyasi-Agyei, Y. and Randall, T. (2018). The evolution of urban water metering and conservation in Australia. Flow Measurement and Instrumentation, 62,19-26.
Liu, A., Giurco, D., Mukheibir, P. (2016). Urban water conservation through customised water and end-use information. Journal of Cleaner Production, 112, 3164-3175.
Neal, E. (1994). Report of the Working Group on Water Resource Policy to the Council of Australian Governments. COAG Working Group on Water Resource Policy.
Oren, G., and Stroh, N. (2013). Mathematical Model for Detection of Leakage in Domestic Water Supply Systems by Reading Consumption from an Analogue Water Meter. International Journal of Environmental Science and Development, 4 (4), 386-389.
Rathnayaka, K., Malano, H., George, B., Arora, M., Maheepala, S., George, B., Nawarathna, B., and Roberts, P. (2015). Seasonal demand dynamics of residential water end-users. Water, 7 (1), 202-216.
Riverina Water County Council (2017). Average Water Use. Available from: https://www.rwcc.nsw.gov.au/save-water/average-water-use (Accessed 31 December 2016).
Smit, S., Tutusaus, M., Curry, E., Messervey, T. and D’andrea, Z. (2015). Business drivers for adopting smart water technology. E-proceedings of the 36th IAHR World Congress 28 June – 3 July, 2015, The Hague, the Netherlands.
Sonderlund, A. L., Smith, J. R., Hutton, C., & Kapelan, Z. (2014). Using Smart Meters for Household Water Consumption Feedback: Knowns and Unknowns. Procedia Engineering, 89, 990-997.
Turner A., Retamal M., White, S., Palfreeman L., and Panikkar A. (2010). Third Party Evaluation of Wide Bay Water Smart Metering and Sustainable Water Pricing Initiative Project. Report prepared by the Snowy Mountains Engineering Corporation in association with the Institute for Sustainable Futures, UTS, for the Department of the Environment, Water, Heritage and the Arts, Canberra.
Willis, R., Stewart, R.A., Panuwatwanich, K., Jones, S., and Kyriakides, A. (2010). Alarming visual display monitors affecting shower end use water and energy conservation in Australian residential households. Resources Conservation and Recycling, 54, 1117–1127.
Share